Published Book on Amazon
| All of IOT Starting with the Latest Raspberry Pi from Beginner to Advanced – Volume 1 | |
| All of IOT Starting with the Latest Raspberry Pi from Beginner to Advanced – Volume 2 |
출판된 한글판 도서
| 최신 라즈베리파이(Raspberry Pi)로 시작하는 사물인터넷(IOT)의 모든 것 – 초보에서 고급까지 (상) | |
| 최신 라즈베리파이(Raspberry Pi)로 시작하는 사물인터넷(IOT)의 모든 것 – 초보에서 고급까지 (하) |
Original Book Contents
19.1 CPU, Memory and Task
CPU and memory are the resources that the system has, and it is the task or process that uses these resources to perform the works specified by the user. Therefore, it is necessary to monitor the available resources in the system and the processes that are using resources at the present time to check whether there is a problem in the current work processing state.
19.1.1 Checking System Status
19.1.1.1 "top" Command - Check Main System Information
You can use the "top" command to check the overall status of the system.
[Command Format]
| top [ options ] |
[Command Overview]
■ This provides real-time information about the system.
■ User privilege -- Normal user.
[Detail Description]
■ "top" command provides real-time information about the operating system. It provides summary information about the entire system, as well as a list of individual processes or threads managed by the Linux kernel.
■ All of the information provided here can be retrieved and adjusted by the user using the internal command line provided on the screen, and such adjustment can be stored and used again.
■ The information provided here is continuously updated with new information at regular intervals.
[Main option]
| -h | Print help and then exit. |
| -b : Batch-mode operation
| Starts top in 'Batch' mode, which could be useful for sending output from top to other programs or to a file. In this mode, top will not accept input and runs until the iterations limit you've set with the '-n' Shell option or until killed. |
| -d : Delay-time interval as: -d ss.tt (secs.tenths) | Specifies the delay between screen updates, and overrides the corresponding value in one's personal configuration file or the startup default. Later this can be changed with the 'd' or 's' interactive commands. |
| -H : Threads-mode operation
| Instructs top to display individual threads. Without this Shell option a summation of all threads in each process is shown. Later this can be changed with the 'H' interactive command. |
| -p : Monitor-PIDs mode as: -pN1 -pN2 ... or -pN1,N2,N3 ... | Monitor only processes with specified process IDs. This option can be given up to 20 times, or you can provide a comma delimited list with up to 20 pids. Co-mingling both approaches is permitted. |
| -u | -U : User-filter-mode as: -u | -U number or name | Display only processes with a user id or user name matching that given. The '-u' option matches on effective user whereas the '-U' option matches on any user (real, effective, saved, or filesystem). The 'p', 'u' and 'U' Shell options are mutually exclusive. |
[Used Example]
The following shows the result of executing the "top" command.
| pi@raspberrypi ~ $ top |
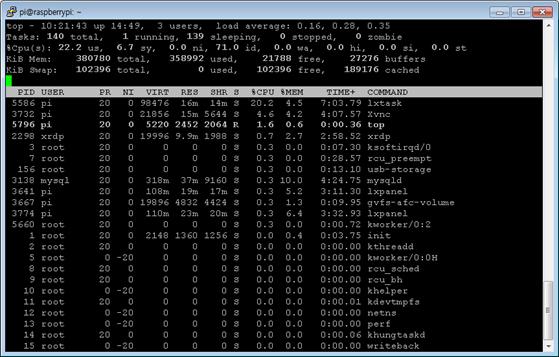
Figure 19‑1 System monitoring – "top" command
You can see that the information provided on this screen is update continuously with the new contents over time, even if the user does not give special instructions.
The header section on the screen is the overall summary data, and the list section below the screen shows detailed information about individual processes or threads.
The part of screen between the header section and the list section is the internal command line. You can make the necessary commands and adjust the contents and appearance of the screen in various ways. You can also execute "kill" task, and so on if you need to terminate a particular process.
The following is a description of the information items displayed in the header.
|
|
|
|
| %CPU | us | Amount allocated to the user application |
|
| sy | Amount allocated to the system application |
|
| ni | Amount allocated to nice process |
|
| id | Idle |
|
| wa | Amount allocated to the I/O waiting process |
|
| hi | Amount allocated to hardware interrupt waiting process |
|
| si | Amount allocated to software interrupt waiting process |
|
| st | hypervisor에 뺏긴 량 Amount taken by hypervisor |
| process 목록 | PID | Process id |
|
| PPID | Parent process의 process id |
|
| Command | A command or program that process run |
|
| PR | Priority of process |
|
| VIRT | amount of virtual memory used |
|
| RES | Amount of resident memory in use |
|
| SHR | Amount of shared memory in use |
|
| S | Process state |
|
| TIME | CPU time used since task started |
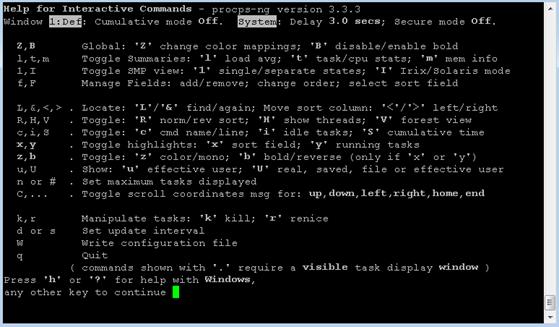
If you need detailed information about the available commands, you can use the help data. Press "h" to see a list of all available commands. If you want to save the adjusted query form and continue to use it next, you can save the setting by pressing "w". Press "q" to end program execution.
19.1.1.2 "free" Command – Check Memory Status
"free" command displays information about the overall memory usage of the system.
[Command Format]
| free [ options ] |
[Command Overview]
■ This shows the overall memory usage of the system.
■ User privilege -- Normal user.
[Detail Description]
"free" command summarizes and displays the total amount, usage, and spare capacity for the physical memory, swap memory, and buffer/cache memory in the system.
[Main option]
| --help | Print help. |
| -k, --kilo | Display the amount of memory in kilobytes. This is the default. |
| -m, --mega | Display the amount of memory in megabytes |
[Used Example]
The following is the result of executing "free" command.
| pi@raspberrypi ~ $ free |
| total used free shared buffers cached Mem: 380780 359936 20844 0 27560 187772 -/+ buffers/cache: 144604 236176 Swap: 102396 0 102396 |
19.1.1.3 "ps" Command – Check Process Snapshot
"ps" command shows all process list information currently running on the system.
[Command Format]
| ps [ options ] |
[Command Overview]
■ This show all process list information currently running on the system
■ User privilege -- Normal user.
[Detail Description]
If no option is specified, it displays only the processes that the current logon user executed and excludes processes running in the background.
[Main option]
| r | Restrict the selection to only running processes. |
| -N, --deselect | Select all processes except those that fulfill the specified conditions (negates the selection). |
| -e | Select all processes. Identical to -A. |
| -a | Select all processes except both session leaders (see getsid(2)) and processes not associated with a terminal. |
| -C cmdlist
| Select by command name. This selects the processes whose executable name is given in cmdlist. |
| --pid pidlist | Select by process ID. Identical to -p and p. |
| --ppid pidlist | Select by parent process ID. This selects the processes with a parent process ID in pidlist. That is, it selects processes that are children of those listed in pidlist. |
| -u userlist
| Select by effective user ID (EUID) or name. This selects the processes whose effective user name or ID is in userlist. The effective user ID describes the user whose file access permissions are used by the process (see geteuid(2)). Identical to U and --user. |
| -t ttylist
| Select by tty. This selects the processes associated with the terminals given in ttylist. Terminals (ttys, or screens for text output) can be specified in several forms: /dev/ttyS1, ttyS1, S1. A plain "-" may be used to select processes not attached to any terminal. |
| -f | Do full-format listing. This option can be combined with many other UNIX-style options to add additional columns. It also causes the command arguments to be printed. When used with -L, the NLWP (number of threads) and LWP (thread ID) columns will be added. See the c option, the format keyword args, and the format keyword comm. |
[Used Example]
The following is a result screen executing "ps" command without options. Since we are currently running "ps" command on the terminal screen, only "bash" and "ps" are listed.
| pi@raspberrypi ~ $ ps |
| PID TTY TIME CMD 5752 pts/0 00:00:01 bash 6135 pts/0 00:00:00 ps |
The following shows the process information in full with the selection condition "-a" and "-f" option.
| pi@raspberrypi ~ $ ps -af |
| UID PID PPID C STIME TTY TIME CMD pi 3481 3402 0 May28 tty1 00:00:01 -bash pi 3507 3481 0 May28 tty1 00:00:00 /bin/sh /usr/bin/startx pi 3524 3507 0 May28 tty1 00:00:00 xinit /etc/X11/xinit/xinitrc -- /etc/X11/xin pi 3529 3524 0 May28 tty1 00:00:00 /usr/bin/ck-launch-session /usr/bin/dbus-lau pi 3629 3529 0 May28 tty1 00:00:00 /usr/bin/lxsession -s LXDE-pi -e LXDE pi 3632 1 0 May28 tty1 00:00:00 /usr/bin/dbus-launch --exit-with-session x-s pi 3639 3629 0 May28 tty1 00:00:00 openbox --config-file /home/pi/.config/openb pi 3641 3629 0 May28 tty1 00:03:54 lxpanel --profile LXDE-pi pi 3648 1 0 May28 tty1 00:00:00 /usr/lib/arm-linux-gnueabihf/lxpolkit pi 3672 1 0 May28 tty1 00:00:05 /usr/lib/arm-linux-gnueabihf/libmenu-cache1/ pi 5349 3629 0 09:11 tty1 00:00:01 pcmanfm --desktop --profile LXDE-pi pi 6139 5752 0 13:42 pts/0 00:00:00 ps -af |
Below is a description of the items shown in the result data.
| 항목 | 설명 |
| PID | process id |
| PPID | Process id of the parent process |
| C | CPU Usage of Process |
| STIME | Process start time |
| TTY | Terminal with process attached |
| UID | user id |
| TIME | CPU time used since task started |
| CMD | Command and argument that executed the process |
When many processes are displayed with "ps" command, you can use "grep" command to select only the data you want from the output data to select only the desired process. The following is a list of processes related to <Motion> program from the entire process list output by "ps" command.
| pi@raspberrypi ~ $ ps -ef | grep motion |
| motion 6835 1 1 19:07 ? 00:01:19 /usr/bin/motion pi 7053 6586 0 20:16 pts/0 00:00:00 grep --color=auto motion |
19.1.1.4 System Monitoring with Desktop Window
When accessing Raspberry Pi's Desktop window, Task Manager can be used to monitor the system through Desktop window. If you run Application Menu Menu àAccessories àTask Manager, the Task Manager's screen appears as shown bellow.
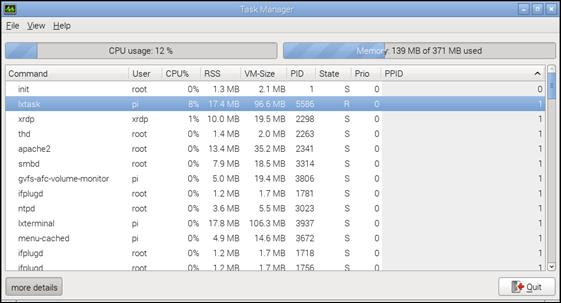
Figure 19‑2 Desktop window [Task Manager]
This program shows the current state of resources such as CPU and memory of the system, and shows information about the type of task that the user wants among various tasks currently being executed.
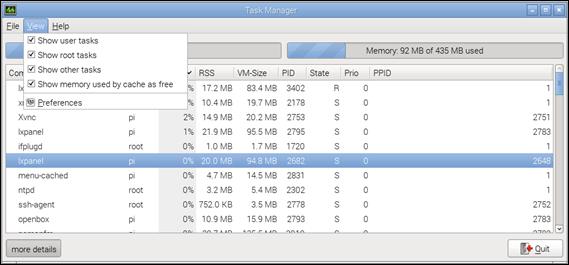
You can see that the information on the screen is updated continuously with new contents over time even if the user does not give special instructions. The time interval to be updated can be changed in menu View àPreferences.
Also, you can selectively check various kinds of tasks by using menu View at the top as shown in the screen below.